Monitoring & Observability
Complete guide for monitoring Vectra in production with Prometheus, Grafana, and APM tools.
Quick Setup
Vectra.configure do |config|
  config.provider = :pinecone
  config.api_key = ENV['PINECONE_API_KEY']
  config.instrumentation = true  # Enable metrics
end
Prometheus Metrics
Exporter Setup
Create config/initializers/vectra_metrics.rb:
# frozen_string_literal: true

require "prometheus/client"

module VectraMetrics
  REGISTRY = Prometheus::Client.registry

  # Request counters
  REQUESTS_TOTAL = REGISTRY.counter(
    :vectra_requests_total,
    docstring: "Total Vectra requests",
    labels: [:provider, :operation, :status]
  )

  # Latency histogram
  REQUEST_DURATION = REGISTRY.histogram(
    :vectra_request_duration_seconds,
    docstring: "Request duration in seconds",
    labels: [:provider, :operation],
    buckets: [0.01, 0.025, 0.05, 0.1, 0.25, 0.5, 1, 2.5, 5, 10]
  )

  # Vector counts
  VECTORS_PROCESSED = REGISTRY.counter(
    :vectra_vectors_processed_total,
    docstring: "Total vectors processed",
    labels: [:provider, :operation]
  )

  # Cache metrics
  CACHE_HITS = REGISTRY.counter(
    :vectra_cache_hits_total,
    docstring: "Cache hit count"
  )

  CACHE_MISSES = REGISTRY.counter(
    :vectra_cache_misses_total,
    docstring: "Cache miss count"
  )

  # Pool metrics (pgvector)
  POOL_SIZE = REGISTRY.gauge(
    :vectra_pool_connections,
    docstring: "Connection pool size",
    labels: [:state]  # available, checked_out
  )

  # Error counter
  ERRORS_TOTAL = REGISTRY.counter(
    :vectra_errors_total,
    docstring: "Total errors",
    labels: [:provider, :error_type]
  )
end

# Custom instrumentation handler
Vectra::Instrumentation.register(:prometheus) do |event|
  labels = {
    provider: event[:provider],
    operation: event[:operation]
  }

  # Record request
  status = event[:error] ? "error" : "success"
  VectraMetrics::REQUESTS_TOTAL.increment(labels: labels.merge(status: status))

  # Record duration
  if event[:duration]
    VectraMetrics::REQUEST_DURATION.observe(event[:duration], labels: labels)
  end

  # Record vector count
  if event[:metadata]&.dig(:vector_count)
    VectraMetrics::VECTORS_PROCESSED.increment(
      by: event[:metadata][:vector_count],
      labels: labels
    )
  end

  # Record errors
  if event[:error]
    VectraMetrics::ERRORS_TOTAL.increment(
      labels: labels.merge(error_type: event[:error].class.name)
    )
  end
end
Prometheus Scrape Config
Add to prometheus.yml:
scrape_configs:
  - job_name: 'vectra'
    static_configs:
      - targets: ['localhost:9292']
    metrics_path: '/metrics'
    scrape_interval: 15s
Expose Metrics Endpoint (Rack)
# config.ru
require "prometheus/middleware/exporter"

use Prometheus::Middleware::Exporter
run YourApp
Grafana Dashboard
Live Dashboard Preview
Vectra includes a comprehensive Grafana dashboard with 11 professional panels for monitoring all aspects of your vector database operations:
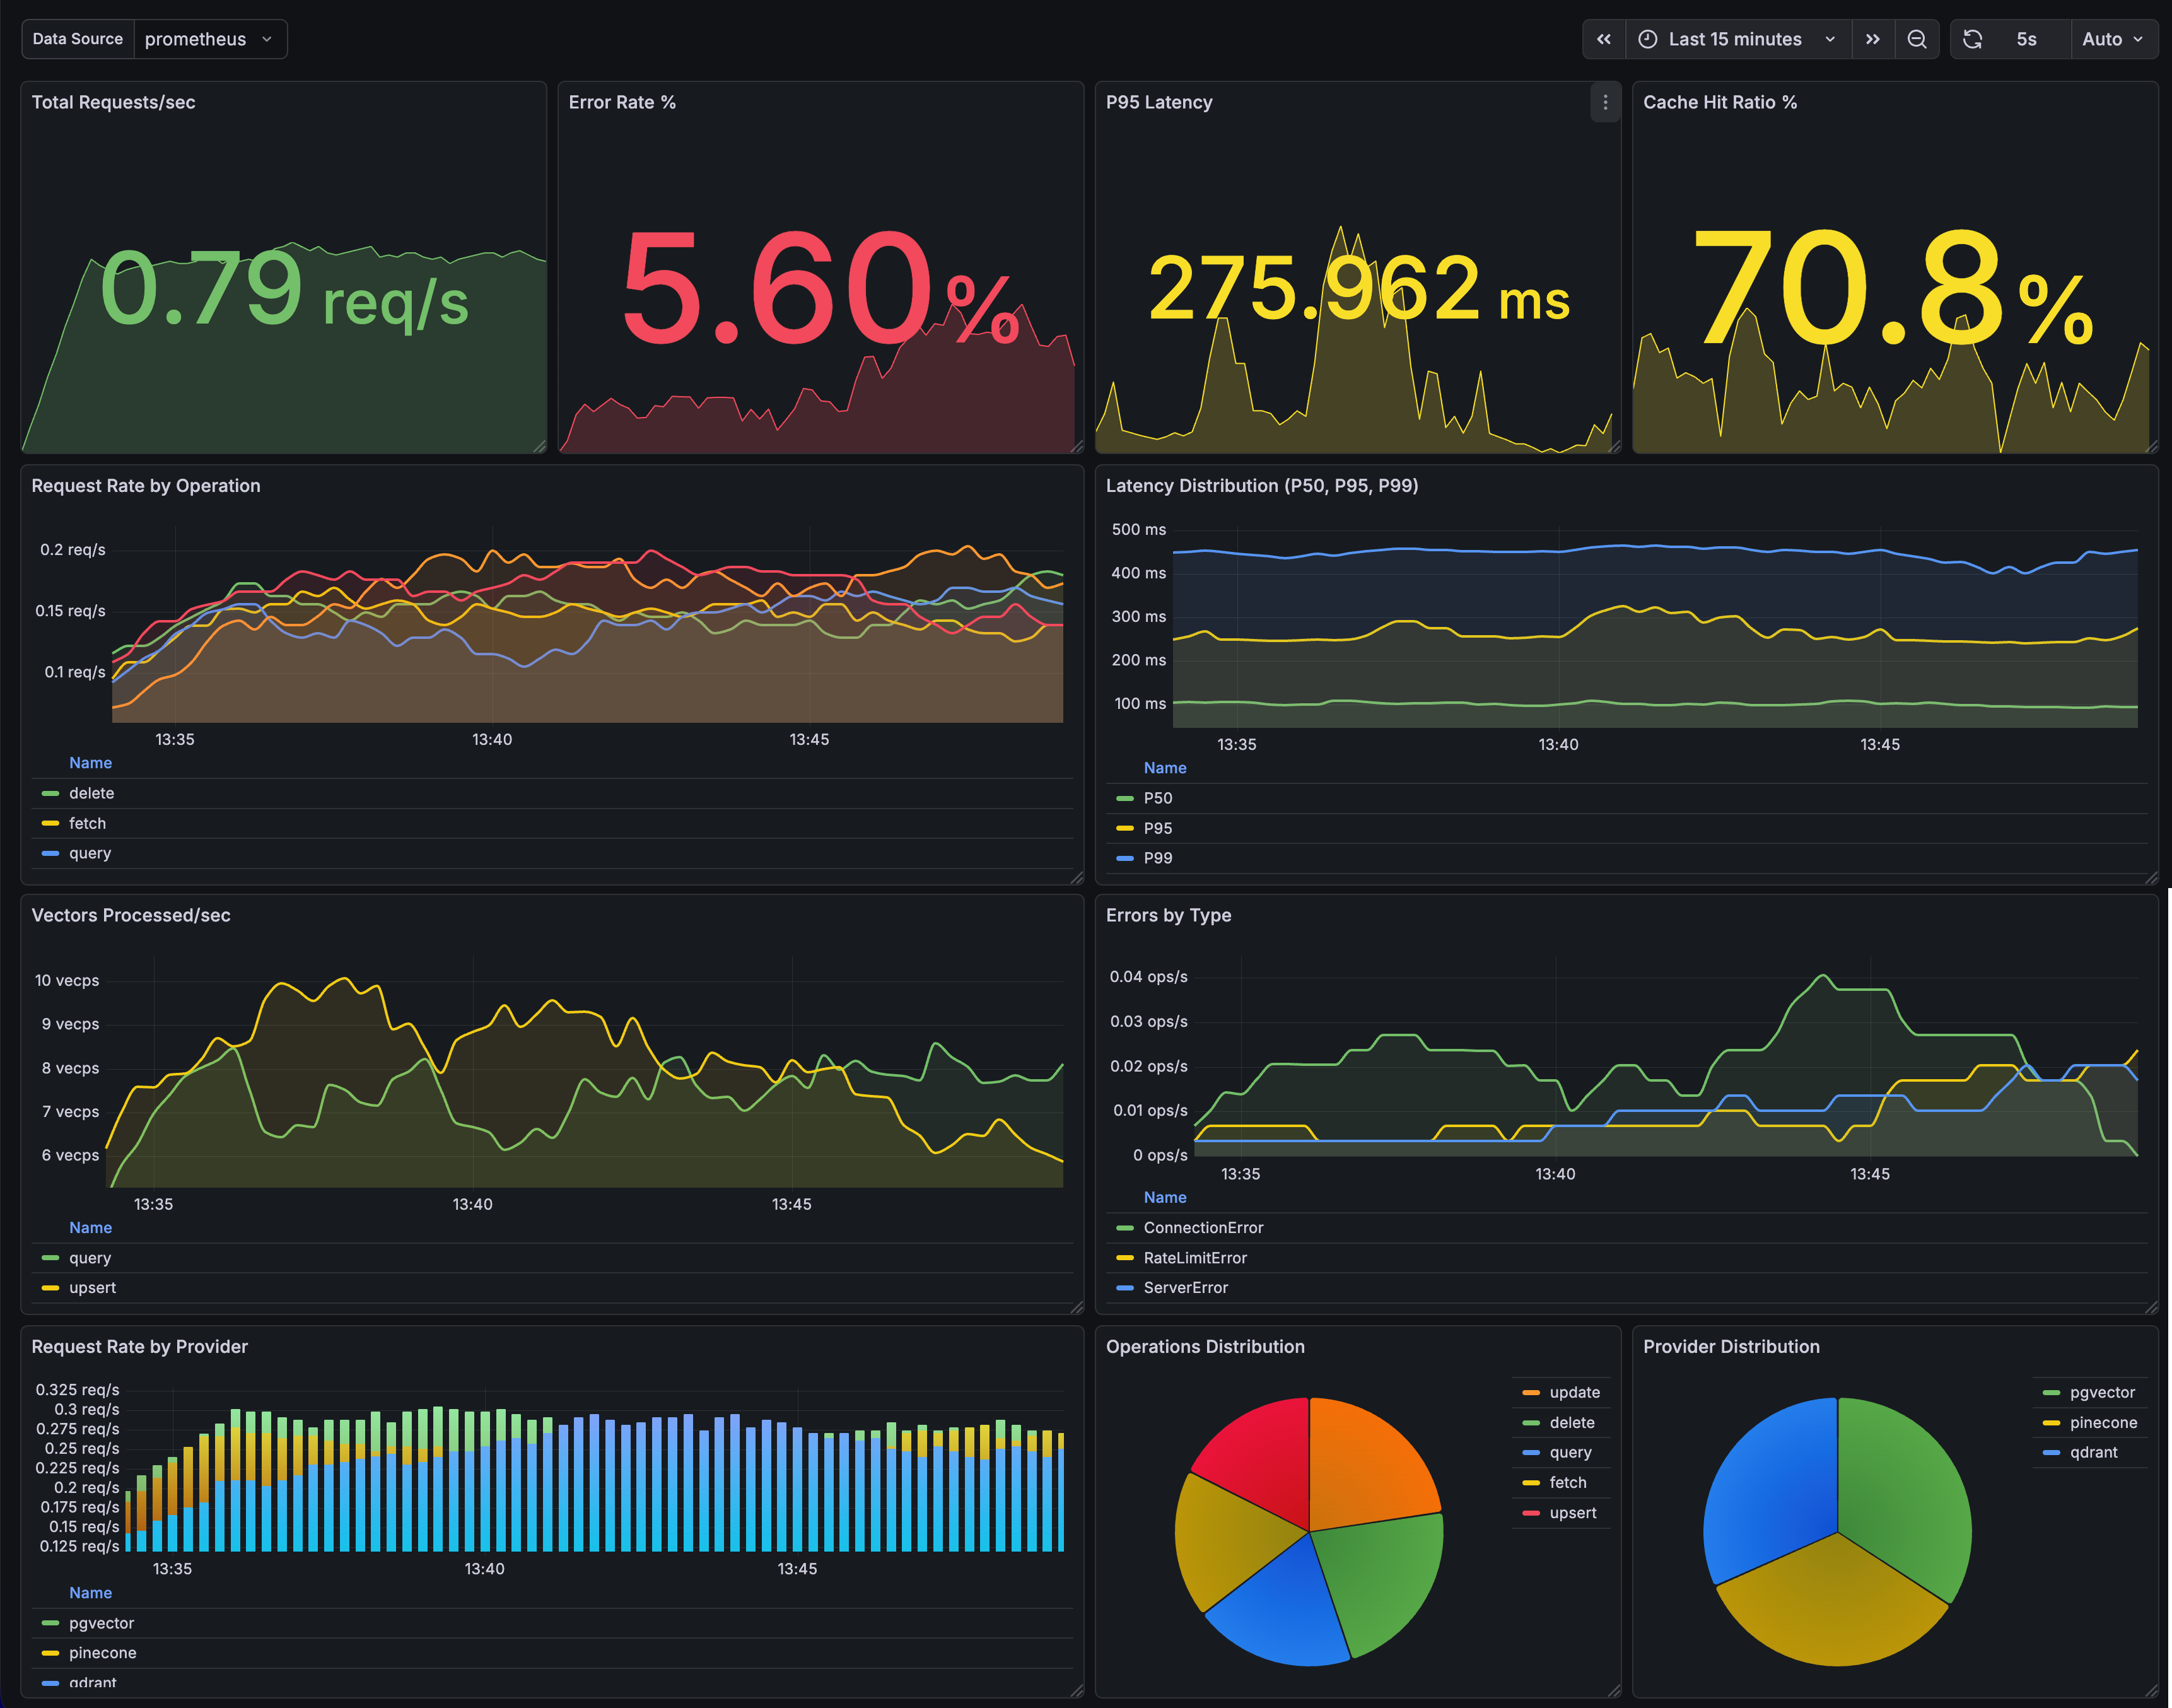
Dashboard Features
- Real-time Metrics: Request rate, latency, error tracking
- Performance Monitoring: P50, P95, P99 latency percentiles
- Cache Analytics: Hit ratio and performance metrics
- Provider Insights: Multi-provider comparison and distribution
- Connection Pooling: pgvector pool status and utilization
- Visual Analytics: Time series, pie charts, bar gauges
Quick Setup
Get started in 5 minutes:
- Start Prometheus Exporter:
gem install prometheus-client ruby examples/prometheus-exporter.rb - Import Dashboard:
- Sign up at grafana.com (free tier available)
- Add Prometheus data source
- Import
examples/grafana-dashboard.json
- View Metrics:
- Dashboard populates with real-time data
- Perfect for monitoring and screenshots
See the Quick Start Guide for detailed setup instructions.
Dashboard JSON Template
Save as vectra-dashboard.json and import into Grafana:
{
  "dashboard": {
    "title": "Vectra Vector Database Metrics",
    "uid": "vectra-metrics",
    "timezone": "browser",
    "refresh": "30s",
    "panels": [
      {
        "title": "Request Rate",
        "type": "graph",
        "gridPos": { "x": 0, "y": 0, "w": 12, "h": 8 },
        "targets": [
          {
            "expr": "sum(rate(vectra_requests_total[5m])) by (operation)",
            "legendFormat": "" }}"
          }
        ]
      },
      {
        "title": "Request Latency (p95)",
        "type": "graph",
        "gridPos": { "x": 12, "y": 0, "w": 12, "h": 8 },
        "targets": [
          {
            "expr": "histogram_quantile(0.95, sum(rate(vectra_request_duration_seconds_bucket[5m])) by (le, operation))",
            "legendFormat": "" }} p95"
          }
        ]
      },
      {
        "title": "Error Rate",
        "type": "graph",
        "gridPos": { "x": 0, "y": 8, "w": 12, "h": 8 },
        "targets": [
          {
            "expr": "sum(rate(vectra_errors_total[5m])) by (error_type)",
            "legendFormat": "" }}"
          }
        ]
      },
      {
        "title": "Vectors Processed",
        "type": "stat",
        "gridPos": { "x": 12, "y": 8, "w": 6, "h": 8 },
        "targets": [
          {
            "expr": "sum(increase(vectra_vectors_processed_total[24h]))",
            "legendFormat": "24h Total"
          }
        ]
      },
      {
        "title": "Cache Hit Ratio",
        "type": "gauge",
        "gridPos": { "x": 18, "y": 8, "w": 6, "h": 8 },
        "targets": [
          {
            "expr": "sum(vectra_cache_hits_total) / (sum(vectra_cache_hits_total) + sum(vectra_cache_misses_total)) * 100"
          }
        ],
        "fieldConfig": {
          "defaults": {
            "unit": "percent",
            "max": 100,
            "thresholds": {
              "steps": [
                { "color": "red", "value": 0 },
                { "color": "yellow", "value": 50 },
                { "color": "green", "value": 80 }
              ]
            }
          }
        }
      },
      {
        "title": "Connection Pool (pgvector)",
        "type": "graph",
        "gridPos": { "x": 0, "y": 16, "w": 12, "h": 8 },
        "targets": [
          {
            "expr": "vectra_pool_connections{state='available'}",
            "legendFormat": "Available"
          },
          {
            "expr": "vectra_pool_connections{state='checked_out'}",
            "legendFormat": "In Use"
          }
        ]
      },
      {
        "title": "Operations by Provider",
        "type": "piechart",
        "gridPos": { "x": 12, "y": 16, "w": 12, "h": 8 },
        "targets": [
          {
            "expr": "sum(vectra_requests_total) by (provider)",
            "legendFormat": "" }}"
          }
        ]
      }
    ],
    "templating": {
      "list": [
        {
          "name": "provider",
          "type": "query",
          "query": "label_values(vectra_requests_total, provider)",
          "multi": true,
          "includeAll": true
        }
      ]
    }
  }
}
APM Integration
Datadog
# config/initializers/vectra_datadog.rb
require "vectra/instrumentation/datadog"

Vectra.configure do |config|
  config.instrumentation = true
end

# Auto-traces all Vectra operations with:
# - Service name: vectra
# - Resource: operation name (upsert, query, etc.)
# - Tags: provider, index, vector_count
Datadog Dashboard JSON
{
  "title": "Vectra Performance",
  "widgets": [
    {
      "definition": {
        "title": "Request Rate by Operation",
        "type": "timeseries",
        "requests": [
          {
            "q": "sum:vectra.request.count{*} by {operation}.as_rate()",
            "display_type": "bars"
          }
        ]
      }
    },
    {
      "definition": {
        "title": "P95 Latency",
        "type": "timeseries",
        "requests": [
          {
            "q": "p95:vectra.request.duration{*} by {operation}"
          }
        ]
      }
    },
    {
      "definition": {
        "title": "Error Rate",
        "type": "query_value",
        "requests": [
          {
            "q": "sum:vectra.error.count{*}.as_rate() / sum:vectra.request.count{*}.as_rate() * 100"
          }
        ],
        "precision": 2,
        "custom_unit": "%"
      }
    }
  ]
}
New Relic
# config/initializers/vectra_newrelic.rb
require "vectra/instrumentation/new_relic"

Vectra.configure do |config|
  config.instrumentation = true
end

# Records custom events: VectraOperation
# Attributes: provider, operation, duration, vector_count, error
New Relic NRQL Queries
-- Request throughput
SELECT rate(count(*), 1 minute) FROM VectraOperation FACET operation TIMESERIES

-- Average latency by operation
SELECT average(duration) FROM VectraOperation FACET operation TIMESERIES

-- Error rate
SELECT percentage(count(*), WHERE error IS NOT NULL) FROM VectraOperation TIMESERIES

-- Slowest operations
SELECT max(duration) FROM VectraOperation FACET operation WHERE duration > 1
Sentry
# config/initializers/vectra_sentry.rb
require 'vectra/instrumentation/sentry'

Vectra.configure do |config|
  config.instrumentation = true
end

# Setup with options
Vectra::Instrumentation::Sentry.setup!(
  capture_all_errors: false,        # Only capture failures
  fingerprint_by_operation: true    # Group errors by operation
)

# Features:
# - Breadcrumbs for all operations
# - Error context with provider/operation/index
# - Custom fingerprinting for error grouping
# - Severity levels based on error type
Honeybadger
# config/initializers/vectra_honeybadger.rb
require 'vectra/instrumentation/honeybadger'

Vectra.configure do |config|
  config.instrumentation = true
end

Vectra::Instrumentation::Honeybadger.setup!(
  notify_on_rate_limit: false,   # Don't spam on rate limits
  notify_on_validation: false    # Don't spam on validation errors
)

# Features:
# - Breadcrumbs for operation tracing
# - Context with vectra metadata
# - Severity tags (critical, high, medium, low)
# - Custom fingerprinting
OpenTelemetry
# config/initializers/vectra_otel.rb
require "opentelemetry/sdk"
require "opentelemetry/exporter/otlp"

OpenTelemetry::SDK.configure do |c|
  c.service_name = "vectra-service"
  c.use_all
end

# Custom OpenTelemetry handler
Vectra::Instrumentation.register(:opentelemetry) do |event|
  tracer = OpenTelemetry.tracer_provider.tracer("vectra")

  tracer.in_span("vectra.#{event[:operation]}") do |span|
    span.set_attribute("vectra.provider", event[:provider].to_s)
    span.set_attribute("vectra.index", event[:index]) if event[:index]
    span.set_attribute("vectra.vector_count", event[:metadata][:vector_count]) if event.dig(:metadata, :vector_count)

    if event[:error]
      span.record_exception(event[:error])
      span.status = OpenTelemetry::Trace::Status.error(event[:error].message)
    end
  end
end
Alert Configurations
Prometheus Alerting Rules
Save as vectra-alerts.yml:
groups:
  - name: vectra
    rules:
      # High error rate
      - alert: VectraHighErrorRate
        expr: |
          sum(rate(vectra_errors_total[5m]))
          / sum(rate(vectra_requests_total[5m])) > 0.05
        for: 5m
        labels:
          severity: critical
        annotations:
          summary: "High Vectra error rate"
          description: "Error rate is  (threshold: 5%)"

      # High latency
      - alert: VectraHighLatency
        expr: |
          histogram_quantile(0.95,
            sum(rate(vectra_request_duration_seconds_bucket[5m])) by (le, operation)
          ) > 2
        for: 5m
        labels:
          severity: warning
        annotations:
          summary: "High Vectra latency for "
          description: "P95 latency is "

      # Connection pool exhausted (pgvector)
      - alert: VectraPoolExhausted
        expr: vectra_pool_connections{state="available"} == 0
        for: 1m
        labels:
          severity: critical
        annotations:
          summary: "Vectra connection pool exhausted"
          description: "No available connections in pool"

      # Low cache hit ratio
      - alert: VectraLowCacheHitRatio
        expr: |
          sum(rate(vectra_cache_hits_total[5m]))
          / (sum(rate(vectra_cache_hits_total[5m])) + sum(rate(vectra_cache_misses_total[5m]))) < 0.5
        for: 10m
        labels:
          severity: warning
        annotations:
          summary: "Low Vectra cache hit ratio"
          description: "Cache hit ratio is "

      # No requests (service down?)
      - alert: VectraNoRequests
        expr: sum(rate(vectra_requests_total[5m])) == 0
        for: 10m
        labels:
          severity: warning
        annotations:
          summary: "No Vectra requests"
          description: "No requests in the last 10 minutes"
PagerDuty Integration
# alertmanager.yml
receivers:
  - name: 'vectra-critical'
    pagerduty_configs:
      - service_key: '<your-pagerduty-key>'
        severity: critical
        description: ''
        details:
          summary: ''
          description: ''

route:
  receiver: 'vectra-critical'
  routes:
    - match:
        severity: critical
      receiver: 'vectra-critical'
Slack Alerts
# alertmanager.yml
receivers:
  - name: 'vectra-slack'
    slack_configs:
      - api_url: '<your-slack-webhook>'
        channel: '#alerts'
        title: ''
        text: ''
        color: 'dangergood'
Circuit Breaker Pattern
Prevent cascading failures with built-in circuit breaker:
# Create circuit breaker for provider
breaker = Vectra::CircuitBreaker.new(
  name: "pinecone",
  failure_threshold: 5,    # Open after 5 failures
  success_threshold: 3,    # Close after 3 successes in half-open
  recovery_timeout: 30     # Try half-open after 30 seconds
)

# Use with operations
result = breaker.call do
  client.query(index: "my-index", vector: vec, top_k: 10)
end

# With fallback
result = breaker.call(fallback: -> { cached_results }) do
  client.query(...)
end
Circuit States
| State | Description | Behavior |
|---|---|---|
closed |
Normal operation | Requests pass through |
open |
Failing | Requests fail immediately (or use fallback) |
half_open |
Testing recovery | Limited requests allowed |
Per-Provider Circuits
# Register circuits for each provider
Vectra::CircuitBreakerRegistry.register(:pinecone, failure_threshold: 3)
Vectra::CircuitBreakerRegistry.register(:qdrant, failure_threshold: 5)

# Use registered circuit
Vectra::CircuitBreakerRegistry[:pinecone].call do
  pinecone_client.query(...)
end

# Get all circuit stats
Vectra::CircuitBreakerRegistry.stats
# => { pinecone: { state: :closed, ... }, qdrant: { state: :open, ... } }

# Reset all circuits
Vectra::CircuitBreakerRegistry.reset_all!
Circuit Breaker Metrics
# Add to Prometheus metrics
Vectra::Instrumentation.on_operation do |event|
  circuit = Vectra::CircuitBreakerRegistry[event.provider]
  next unless circuit

  CIRCUIT_STATE.set(
    circuit.open? ? 1 : 0,
    labels: { provider: event.provider.to_s }
  )
end
Circuit Breaker Alerts
# prometheus-alerts.yml
- alert: VectraCircuitOpen
  expr: vectra_circuit_state == 1
  for: 1m
  labels:
    severity: critical
  annotations:
    summary: "Circuit breaker open for "
Health Check
Built-in health check functionality:
# Basic health check
client = Vectra::Client.new(provider: :pinecone, ...)
result = client.health_check

if result.healthy?
  puts "Provider is healthy! Latency: #{result.latency_ms}ms"
else
  puts "Error: #{result.error_message}"
end

# Quick boolean check
client.healthy?  # => true/false

# Detailed health check with stats
result = client.health_check(
  index: "my-index",
  include_stats: true
)

puts result.to_json
# => {
#   "healthy": true,
#   "provider": "pinecone",
#   "latency_ms": 45.2,
#   "indexes_available": 3,
#   "index": "my-index",
#   "stats": { "vector_count": 1000, "dimension": 384 },
#   "pool": { "available": 5, "checked_out": 2 }
# }
Aggregate Health Check
Check multiple providers at once:
checker = Vectra::AggregateHealthCheck.new(
  primary: pinecone_client,
  backup: qdrant_client,
  local: pgvector_client
)

result = checker.check_all
# => {
#   overall_healthy: true,
#   healthy_count: 3,
#   total_count: 3,
#   results: { ... }
# }

# Quick checks
checker.all_healthy?   # => true/false
checker.any_healthy?    # => true/false
Health Check Endpoint (Rails)
# app/controllers/health_controller.rb
class HealthController < ApplicationController
  def vectra
    client = Vectra::Client.new
    result = client.health_check(include_stats: true)

    render json: result.to_h, status: result.healthy? ? :ok : :service_unavailable
  end
end
Structured JSON Logging
Built-in JSON logger for machine-readable logs:
# Setup JSON logging
require 'vectra/logging'

Vectra::Logging.setup!(
  output: "log/vectra.json.log",
  app: "my-service",
  env: Rails.env
)

# All operations automatically logged as JSON:
# {
#   "timestamp": "2025-01-08T12:00:00.123Z",
#   "level": "info",
#   "logger": "vectra",
#   "message": "vectra.query",
#   "provider": "pinecone",
#   "operation": "query",
#   "index": "embeddings",
#   "duration_ms": 45.2,
#   "success": true,
#   "result_count": 10
# }
Custom Logging
# Log custom events
Vectra::Logging.log(:info, "Custom event", custom_key: "value")

# Use with standard Logger
logger = Logger.new(STDOUT)
logger.formatter = Vectra::JsonFormatter.new(service: "vectra-api")
Log Levels
debug- Detailed debugging informationinfo- Successful operationswarn- Warnings (rate limits, retries)error- Failed operationsfatal- Critical errors (auth failures)
Rate Limiting
Proactive rate limiting to prevent API rate limit errors:
# Create rate limiter (token bucket algorithm)
limiter = Vectra::RateLimiter.new(
  requests_per_second: 10,
  burst_size: 20
)

# Use with operations
limiter.acquire do
  client.query(index: "my-index", vector: vec, top_k: 10)
end

# Or wrap entire client
rate_limited_client = Vectra::RateLimitedClient.new(
  client,
  requests_per_second: 100,
  burst_size: 200
)

# All operations automatically rate limited
rate_limited_client.query(...)
rate_limited_client.upsert(...)
Per-Provider Rate Limits
# Configure rate limits per provider
Vectra::RateLimiterRegistry.configure(:pinecone, requests_per_second: 100)
Vectra::RateLimiterRegistry.configure(:qdrant, requests_per_second: 50)

# Use in operations
limiter = Vectra::RateLimiterRegistry[:pinecone]
limiter.acquire { client.query(...) }

# Get stats
Vectra::RateLimiterRegistry.stats
Rate Limiter Stats
stats = limiter.stats
# => {
#   requests_per_second: 10,
#   burst_size: 20,
#   available_tokens: 15.5,
#   time_until_token: 0.05
# }
Quick Reference
| Metric | Description | Alert Threshold |
|---|---|---|
vectra_requests_total |
Total requests | - |
vectra_request_duration_seconds |
Request latency | p95 > 2s |
vectra_errors_total |
Error count | > 5% error rate |
vectra_vectors_processed_total |
Vectors processed | - |
vectra_cache_hits_total |
Cache hits | < 50% hit ratio |
vectra_pool_connections |
Pool connections | 0 available |
vectra_rate_limit_tokens |
Available rate limit tokens | < 10% capacity |
Monitoring Cost Optimization
Optimize your monitoring infrastructure costs:
| Setting | Default | Low-Cost | Notes |
|---|---|---|---|
| Scrape interval | 15s | 30s | Reduces storage by ~50% |
| Retention | 15d | 7d | Adjust via --storage.tsdb.retention.time |
| Histogram buckets | 10 | 5 | Fewer buckets = less cardinality |
Metric Cardinality Estimates:
- ~100 timeseries per provider
- ~500 timeseries for multi-provider setup
- Cache/pool metrics add ~20 timeseries
Cost Reduction Tips:
# prometheus.yml - Longer scrape interval
scrape_configs:
  - job_name: 'vectra'
    scrape_interval: 30s  # Instead of 15s
    scrape_timeout: 10s
# Reduce histogram buckets
REQUEST_DURATION = REGISTRY.histogram(
  :vectra_request_duration_seconds,
  docstring: "Request duration",
  labels: [:provider, :operation],
  buckets: [0.1, 0.5, 1, 5, 10]  # 5 instead of 10 buckets
)
Downsampling for Long-term Storage:
# Thanos/Cortex downsampling rules
- record: vectra:request_rate:5m
  expr: sum(rate(vectra_requests_total[5m])) by (provider, operation)
Troubleshooting Runbooks
Quick links to incident response procedures:
- High Error Rate Runbook - Error rate >5%
- Pool Exhaustion Runbook - No available connections
- Cache Issues Runbook - Low hit ratio, stale data
- High Latency Runbook - P95 >2s